

ASX 200 Futures Reversal Patterns Under Scrutiny as Rally Wavers
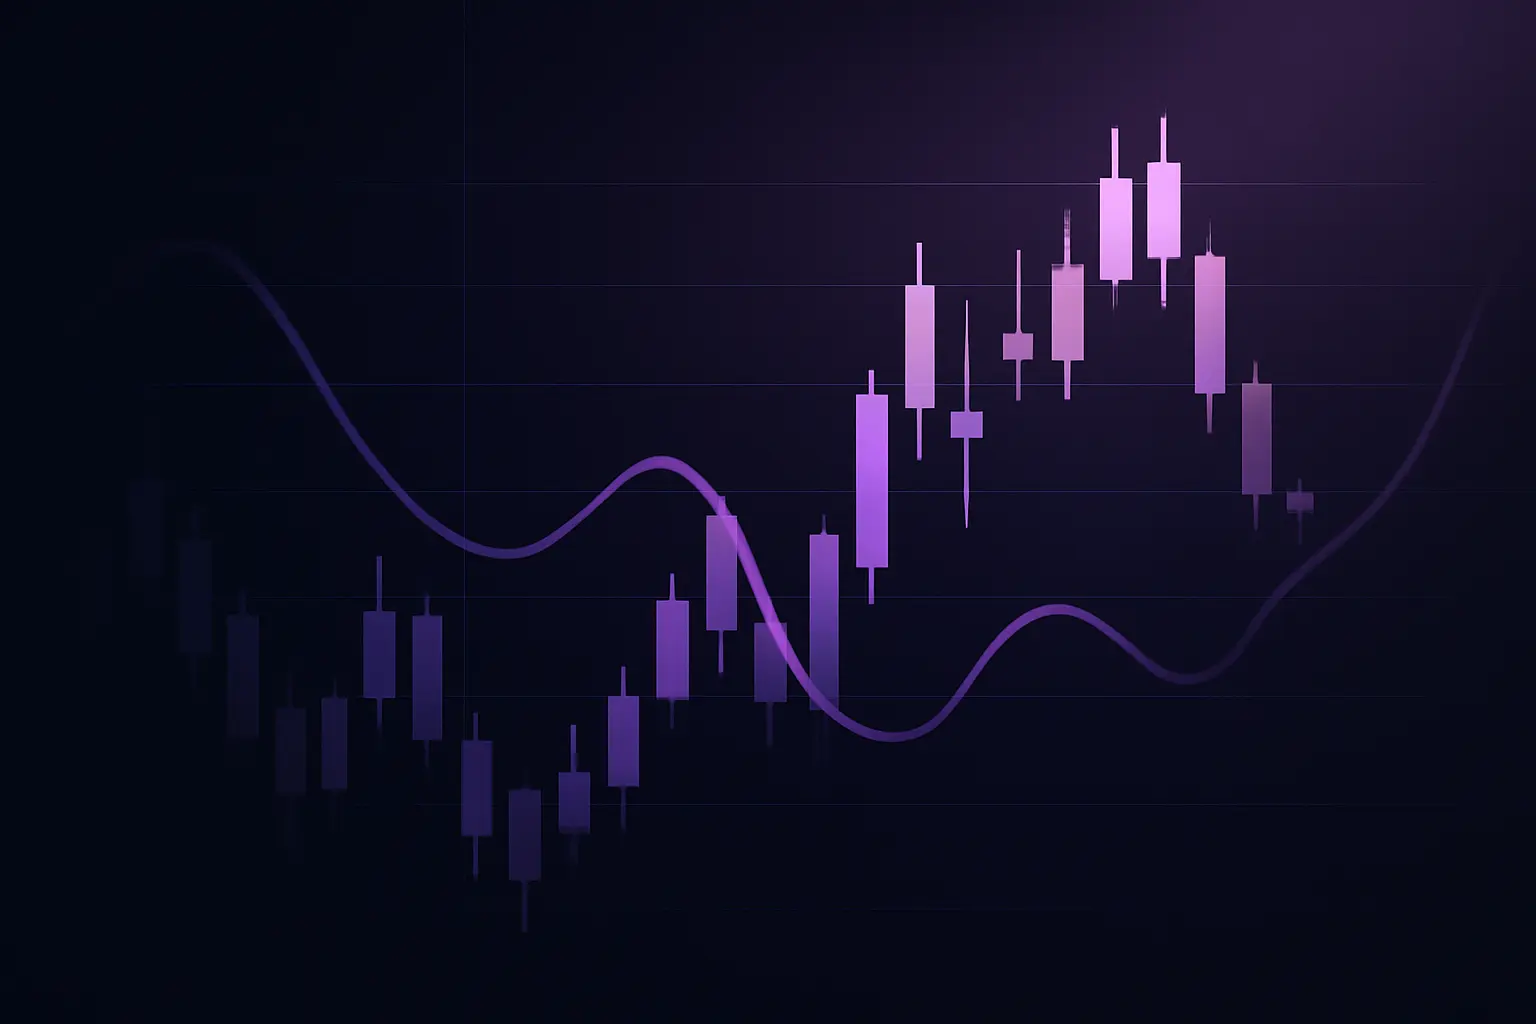
ASX 200 futures show potential reversal signals as the rally tests key resistance. Traders weigh momentum against overbought conditions.
VNIX Quick Take
- ASX 200 futures are flashing possible reversal patterns after a sustained rally.
- Key resistance levels are being tested, raising the stakes for short-term traders.
- Momentum indicators suggest caution, but trend followers see room to run.
ASX 200 Futures Hover at Critical Juncture After Rally
ASX 200 futures have been on a steady climb, but recent price action is now putting reversal patterns to the test. The index has reached a zone where prior supply has historically capped advances, and traders are watching whether buyers can push through or if sellers will regain control.
The current setup is particularly interesting because the rally has been driven by strong risk appetite, yet the futures are now confronting a technical ceiling. Volume patterns and candlestick formations suggest that the move may be losing steam, but confirmation is still pending. A break above the level could open the door to further upside, while a rejection might trigger a pullback toward support.
What's Driving the ASX 200 Futures Hesitation?
Overbought Conditions and Momentum Fatigue
After a prolonged advance, the ASX 200 futures are showing signs of overbought conditions. Momentum oscillators like the Relative Strength Index (RSI) are approaching extreme levels, which historically has preceded at least a pause or a corrective phase. Traders using technical indicators are paying close attention to these signals as they often mark the beginning of a reversal.
However, overbought conditions alone are not a sell signal. In strong trends, markets can remain overbought for extended periods. The key is whether price action confirms the momentum shift, such as a bearish divergence or a break of a short-term trendline.
External Pressures and Risk Sentiment
The broader risk environment is also a factor. Global markets have been sensitive to shifts in interest rate expectations and geopolitical headlines. Any negative surprise could easily trigger a flight to safety, weighing on equity futures. Conversely, positive news could provide the catalyst needed to push through resistance.
Traders are also keeping an eye on the Australian dollar and commodity prices, which often correlate with the index. A softening in commodity prices, especially iron ore, could undermine the resource-heavy ASX 200.
Key Levels to Watch on ASX 200 Futures
For traders, the immediate focus is on the resistance zone that has been tested multiple times. A daily close above this level would signal strength and could attract additional buying. On the downside, the first support is seen at a recent swing low, followed by a more significant support area that aligns with a moving average.
Using real-time price data can help traders track these levels as they develop. It's also useful to monitor the futures market for clues about the cash index open, as gaps can provide additional context.
How Should Traders Approach This Uncertainty?
The current situation presents a classic dilemma: chase the rally or wait for a pullback. For traders who prefer trend-following strategies, the path of least resistance is still up, but risk management becomes crucial. Placing stops below recent swing lows can protect against a sudden reversal.
On the other hand, contrarian traders might look for short opportunities if reversal patterns confirm. However, shorting a strong market is risky and requires patience. Waiting for a clear break of support or a bearish reversal candlestick pattern on higher timeframes could offer a better risk-reward setup.
It's also important to consider the broader market context. The ASX 200 is influenced by global trends, particularly US markets. If the S&P 500 shows similar reversal signals, that would increase the likelihood of a coordinated pullback. Conversely, if US markets continue to rally, the ASX might follow suit despite local headwinds.
Traders can also benefit from engaging with community discussions to see how others are interpreting the same patterns. Sharing ideas can help refine one's own analysis and avoid confirmation bias.
For those new to trading, understanding how to read chart patterns is essential. Reversal patterns like double tops, head and shoulders, or bearish engulfing candles are not foolproof, but they provide a framework for decision-making.
In VNIX's view
The ASX 200 futures are at a pivotal point, but the trend remains intact until proven otherwise. Traders should respect the resistance and watch for confirmation before making aggressive moves. A disciplined approach to risk will be key in this environment.
Educational analysis, not financial advice. Trading involves risk.
Get real-time trade signals
Entry, target and stop-loss for gold, crypto and forex — curated by our team.