

Brent Oil Surges Past $100 as Tesla, Alphabet Losses Drag Wall Street
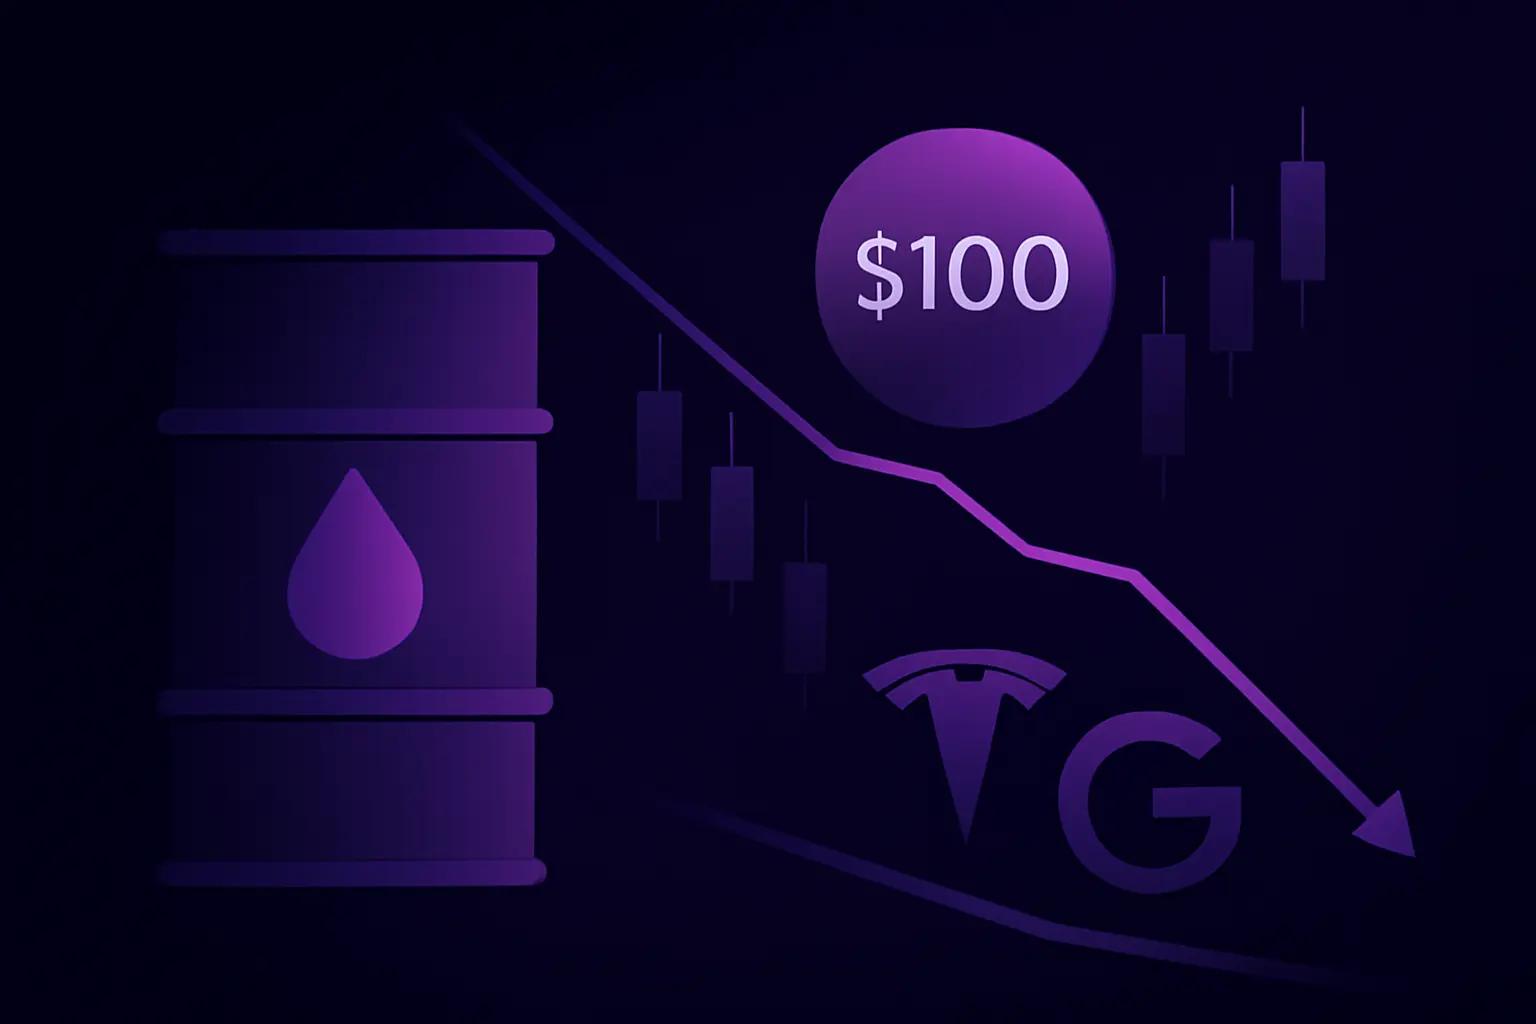
Brent crude tops $100/barrel amid supply fears, while Tesla and Alphabet losses push US equities lower.
US 10Y yield spikes (>4.8%)
Typical directional bias by asset when this plays out — from the VNIX macro impact model. Educational, not financial advice.
VNIX Quick Take
- Brent crude oil climbed above $100 per barrel for the first time since April, driven by supply concerns and geopolitical tensions.
- Wall Street slid as Tesla dropped over 8% and Alphabet fell nearly 5%, dragging the S&P 500 and Nasdaq lower.
- The commodity rally contrasted with equity weakness, highlighting divergent market narratives around inflation and growth.
Brent Crude Breaks $100 as Supply Fears Intensify
Brent crude oil futures surged past the $100 per barrel mark on Wednesday, reaching levels not seen since April. The rally was fueled by tightening global supply, with OPEC+ production cuts and geopolitical instability in key producing regions adding to bullish sentiment. The move marks a significant milestone for oil markets, which have been volatile amid conflicting signals on demand and supply.
The latest price jump came after reports of reduced output from major exporters and ongoing disruptions in the Red Sea shipping lanes. Traders are now watching for potential further upside as inventories draw down. For context, the last time Brent traded above $100 was in early April, before a subsequent pullback to the mid-$80s.
What’s Driving Oil Higher: OPEC+ Cuts and Geopolitical Risks
OPEC+ Production Constraints Keep Supply Tight
The OPEC+ alliance has maintained deep production cuts throughout 2024, with Saudi Arabia and Russia leading voluntary reductions. These measures have steadily drained global inventories, creating a floor under prices. The group’s next meeting in November will be closely watched for any signal of policy change, but for now, the market remains in deficit.
Geopolitical Tensions Add Risk Premium
Ongoing conflicts in the Middle East and disruptions in the Red Sea have added a geopolitical risk premium to crude. Attacks on commercial shipping by Houthi rebels have forced tankers to take longer routes, increasing transportation costs and tightening delivered supply. Any escalation could push prices even higher, though a ceasefire would likely trigger a sharp reversal.
Key Levels to Watch in Oil and Equity Markets
For Brent, the $100 level now acts as psychological support. A sustained break above could target the April high near $105, while a failure to hold might see a retest of $95. On Wall Street, the S&P 500’s 50-day moving average around 5,400 is a key support; a break below could accelerate selling. Traders can track live prices and technical levels using our real-time price charts.
The divergence between oil and equities is unusual and may signal market stress. Historically, such a gap has preceded volatility, as conflicting signals on inflation and growth confuse traders. Monitoring the correlation between these asset classes can help identify turning points.
What This Means for Traders: Inflation vs. Growth Concerns
The simultaneous rise in oil and fall in equities creates a tricky environment. Higher energy costs threaten to reignite inflation, which could force the Federal Reserve to keep interest rates higher for longer—a headwind for stocks. However, the equity sell-off may also reflect growth fears, as consumer spending could weaken under the weight of elevated fuel prices.
Traders should watch for any shift in Fed rhetoric. If policymakers emphasize the inflation risk from oil, rate cut expectations could fade, further pressuring stocks. Conversely, if they downplay the oil spike as transitory, equities might stabilize. For now, the market is pricing in a 50% chance of a rate cut by December, down from 70% a week ago. Beginners can learn more about how macro factors affect trading in our educational hub.
Risk management is crucial during such divergence. Using technical tools like the RSI and MACD can help identify overbought or oversold conditions. For oil, the RSI is above 70, suggesting a potential pullback, while the S&P 500’s RSI is near 40, nearing oversold territory. Traders should avoid chasing moves and wait for clearer signals.
In VNIX's view
The oil-equity divergence highlights a market caught between inflation and growth fears. While oil may have further upside on supply constraints, the equity sell-off reflects genuine concern about the macro outlook. Traders should stay nimble, use stop-losses, and consider hedging strategies. For those looking to discuss trade ideas, our signal rooms offer real-time community insights.
Educational analysis, not financial advice. Trading involves risk.
Track every market in one place
Live prices for gold, crypto, forex and US stocks with a heatmap view.